by Cody Dumont
July 22, 2014

Understanding the sources and destinations of common vulnerabilities strengthens an organization’s ability to manage risk in their environment. Network ports on a host indicate the traffic lanes by which all data travels between hosts. Using this report will empower organizations to better correlate risk with network ports and their associated services.
Identifying risks involves more than looking at the name of the vulnerability and the associated fixes. The same vulnerability can span multiple applications, and require different remediation depending upon the source. Knowing which network port a vulnerability was discovered on helps organizations identify the source of their risk.
This report groups vulnerabilities together by port, so that organizations can know which services are the most vulnerable. Identifying vulnerable ports focuses mitigation efforts when securing applications, rather than focusing by vulnerability or by host. Using this targeted risk analysis, organizations will be better equipped to reduce risk across their most commonly used services, and will have a stronger foundation for risk prevention when expanding their attack surface.
This report is available in the Tenable.sc CV Feed, a comprehensive collection of dashboards, reports, Assurance Report Cards and assets. The dashboard can be easily located in the Tenable.sc Feed under the category Executive. The report requirements are:
- Tenable.sc 5.5.2
- Nessus 8.6.0
- NNM 5.9.0
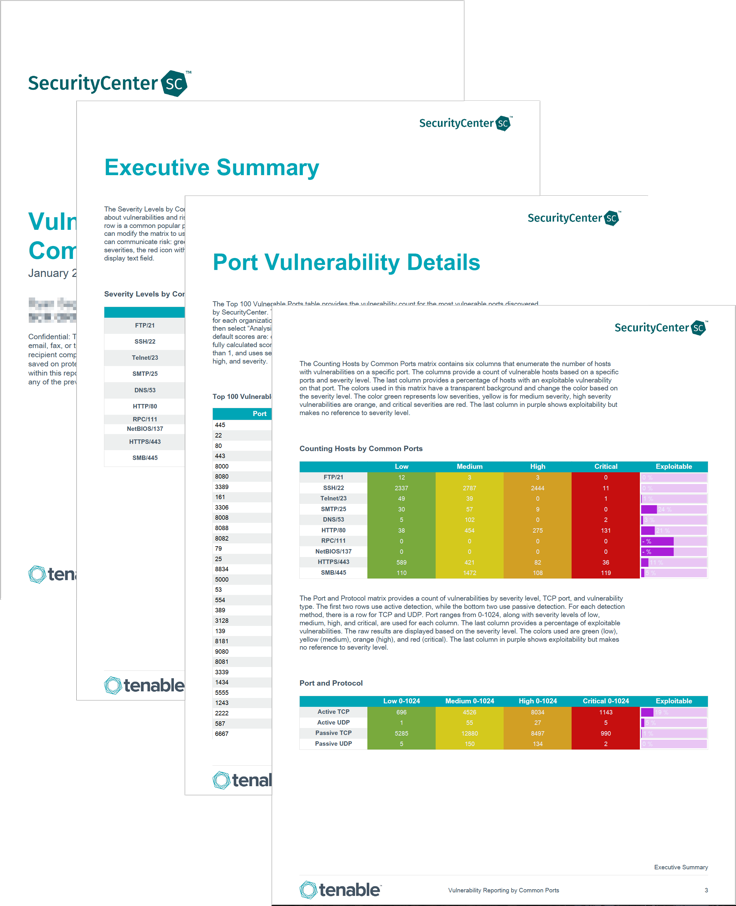
The Executive Summary chapter contains several components that provide system counts and vulnerability counts based on specific port or range of ports. This chapter also illustrates how to monitor risk levels using both CVSS scores and TCP ports. The matrices provide an overview of the many methods that represent data within a matrix. The first matrix provides a sample using the colored icons and an icon with an image, the red “X”. The next two matrices use color codes to represent severity levels and a ratio bar to provide a visual percentage of matched entries. The final two matrices provide eight column matrices and the vulnerability count by CVSS score. The “CVSS Vulnerability Counts Per Port” matrix provides a vulnerability count, and a color based on the severity level. The colors used are: yellow for medium, orange for high severity, and red for critical severities. The last component is a mirror of the previous matrix, but the ratio is displayed. Please note that if the less than 1% of the total vulnerabilities match the respective filter, than 0% will be displayed.
The Port Vulnerability Details chapter contains a top 100 port summary table and is followed by an iterator of each port. For each report a pie chart summarizing the affected networks based on the 24 bit mask (aka class C mask). Two tables, a table listing services found on this port, and a table providing the vulnerability summary and IP details for vulnerabilities found on the respective port follow the pie chart.