by Stephanie Dunn
October 28, 2016

Using enterprise applications provides the ability for organizations to streamline corporate resources and data, which can assist in supporting organizational growth and mobility demands. Although these applications and services provide a cost-effective method for consolidating corporate systems and data into a centralized location, they can also be vulnerable and exploited if left unmanaged. This dashboard leverages data collected from Tenable Nessus, and provides a comprehensive look at vulnerabilities detected on enterprise applications and services throughout the network.
Enterprise applications are utilized within every organization, whether it be for virtualizing servers, collaboration services, using remote desktop, or managing financial investments. Many of these applications and services are vital for business operations. By continuously monitoring enterprise applications for vulnerabilities, organizations can help to ensure critical business operations remain intact.
This dashboard uses the Common Platform Enumeration (CPE) filter to identify vulnerabilities within enterprise software applications and services. According to NIST, the CPE is a structured naming scheme for information technology systems, software, and packages. Based upon the generic syntax for Uniform Resource Identifiers (URI), CPE includes a formal name format, a method for checking names against a system, and a description format for binding text and tests to a name. Tenable assigns CPEs to plugins where appropriate. This allows for analysts to search for common CPE prefixes such as “cpe:/a:adobe:livecycle,” “cpe:/a:microsoft:sharepoint,” and “cpe:/a:oracle:peoplesoft.” Associating CPE strings with vulnerabilities allows the analysts a greater view into separating operating system vulnerabilities from application vulnerabilities, and adds to the level of a vulnerability detail provided to the organization.
Data leveraged within this dashboard is gathered by active vulnerability scanning with Nessus and passive vulnerability detection with Tenable Passive Vulnerability Scanner (PVS). Organizations will gain valuable insight into existing vulnerabilities on enterprise applications and services across the network. An overview of vulnerabilities from each vendor will provide detailed information on vulnerable hosts. Vulnerabilities are tracked by time, severity, and exploitability in order to provide a more complete view of the security status of the network. This data can be used to identify and mitigate potential threat vectors, as well as improving patch management efforts within the organization.
This dashboard is available in the SecurityCenter Feed, a comprehensive collection of dashboards, reports, Assurance Report Cards, and assets. The dashboard can be easily located in the SecurityCenter Feed under the category Threat Detection & Vulnerability Assessments. The dashboard requirements are:
- SecurityCenter 5.3.1
- Nessus 6.8.1
- PVS 5.1.0
Tenable SecurityCenter provides continuous network monitoring, vulnerability identification, and security monitoring. SecurityCenter is continuously updated with information about advanced threats and zero-day vulnerabilities, and new types of regulatory compliance configuration audit files. Tenable constantly analyzes information from our unique sensors, delivering continuous visibility and critical context, enabling decisive action that transforms your security program from reactive to proactive. Active scanning examines software applications on the systems, running processes and services, detection of vulnerable software applications, configuration settings, and additional vulnerabilities. Continuous vulnerability analysis enables security teams to more effectively tailor remediation efforts. Tenable’s extensive network monitoring capabilities enables a powerful, yet non-disruptive, continuous monitoring of the organization to ensure the latest vulnerability information is provided to analysts.
The following components are included in this dashboard:
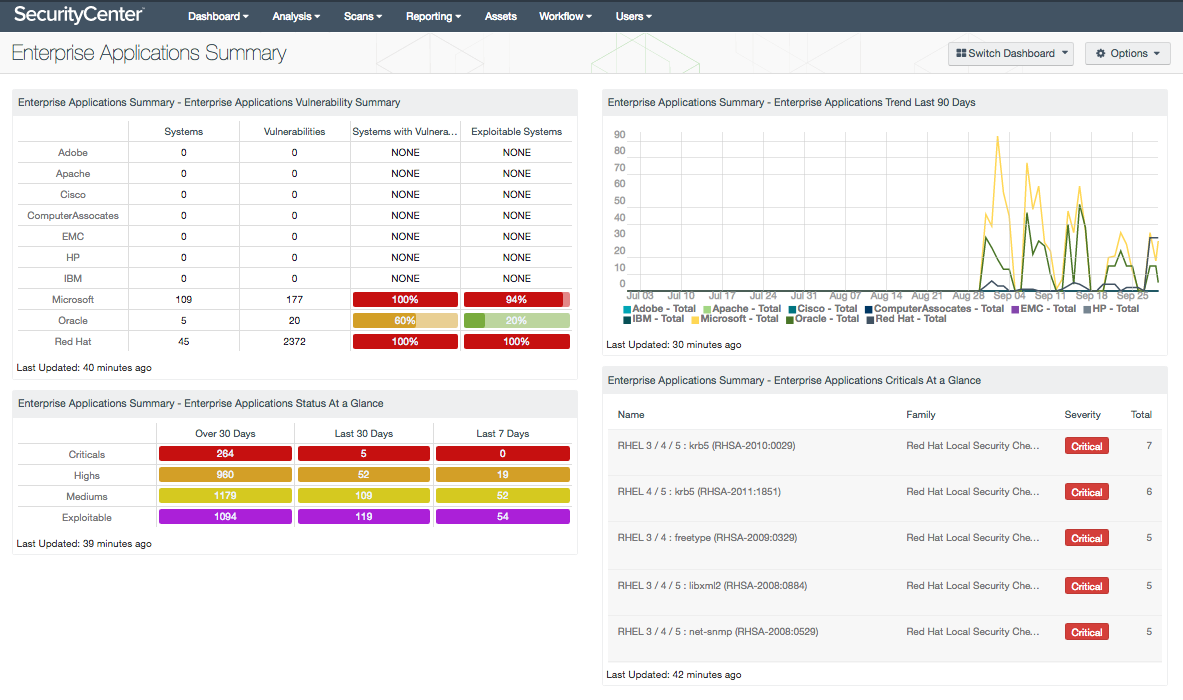
- Enterprise Applications Summary - Enterprise Applications Vulnerability Summary: This matrix presents detailed information on enterprise applications vulnerabilities discovered on systems within the network. For each vendor presented, a count of systems on which the software or service has been located, the number of identified vulnerabilities, the ratio of vulnerable systems, and the ratio of exploitable systems is included. The percentage bars are color-coded based on the percentage of systems that meet the specified filters. The bar turns green when less than 25% of systems meet the filter, yellow when 25-50% of systems do, orange when 50-75% of systems do, and red when more than 75% of systems have been detected with critical, high, or medium severity vulnerabilities. Analysts can drill down to obtain additional information on the detected vulnerability, including IP address, software CPEs, MAC address, and total number of vulnerabilities detected on each host. Analysts can modify this component to include additional or specific CPE data per organizational requirements.
- Enterprise Applications Summary - Enterprise Applications Status at a Glance: This table presents an overview of vulnerabilities detected from enterprise applications and services over time. A count of exploitable vulnerabilities is displayed to highlight vulnerabilities that present the highest level of risk to the organization. Critical, high, and medium severity vulnerabilities are included, with a count of vulnerabilities discovered over the last 7 days, last 30 days, and more than 30 days ago. Security teams can use this component to gain insight into existing vulnerabilities, and how often systems are being patched to remediate these vulnerabilities.
- Enterprise Applications Summary - Enterprise Applications Trend Last 90 Days: This component presents a trend chart of detected vulnerabilities from enterprise applications and services over the last 90 days. Information presented within this component uses the CPE filter to identify vulnerabilities from enterprise applications and services from vendors such as Microsoft, Oracle, and Red Hat. Data points are calculated every 3 days to provide the most accurate trend of vulnerabilities detected over time. This chart can be useful in monitoring the presence of various types of vulnerabilities in enterprise applications over time. Analysts can modify this component to include additional or specific CPE data per organizational requirements.
- Enterprise Applications Summary - Enterprise Applications Criticals at a Glance: This table presents a list of critical severity vulnerabilities detected from enterprise applications and services in use on the network. Relevant vulnerabilities with a critical severity level are shown to focus on the vulnerabilities that present the highest level of risk to the organization. For each vulnerability presented, the plugin name, family, severity, and total count are included. Analysts can drill down to obtain additional information on the detected vulnerability, including IP address, MAC address, and total number of vulnerabilities detected on each host.