by Stephanie Dunn
June 14, 2016

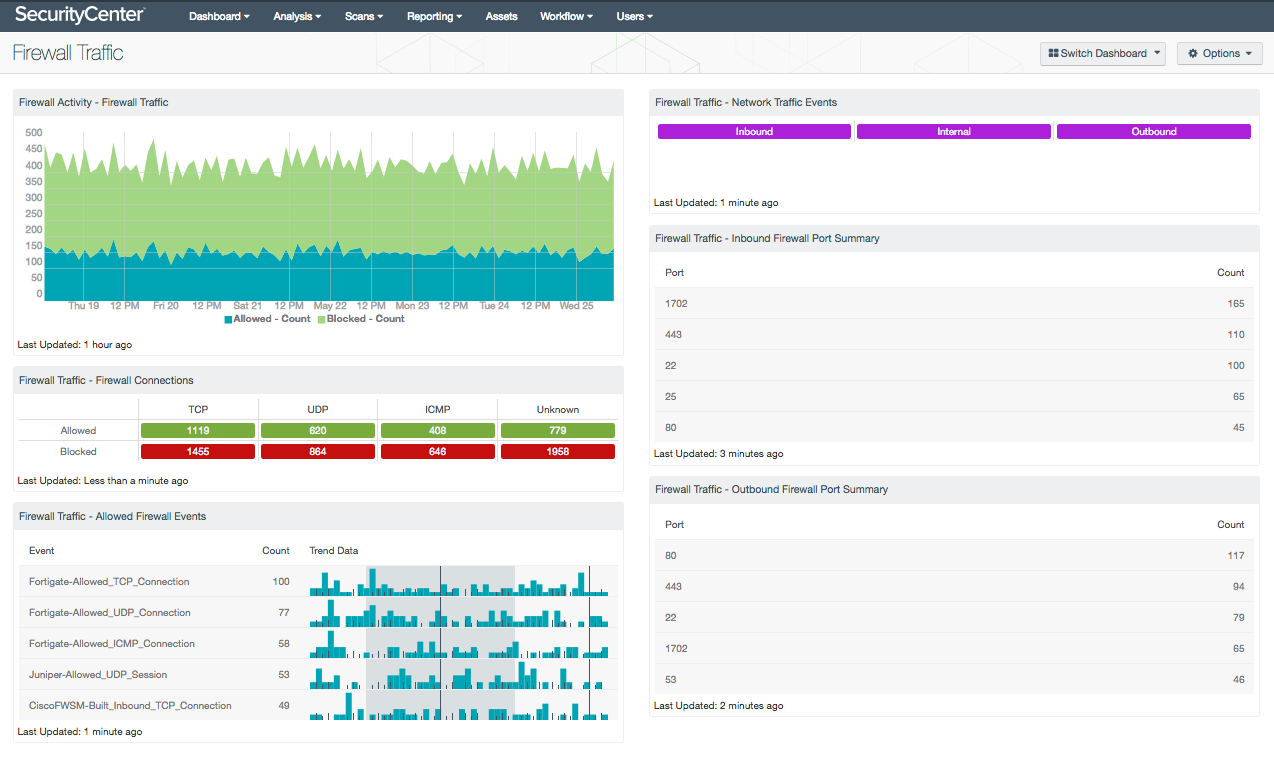
Traditional firewall solutions do not provide the complete protection needed to defend against today’s sophisticated attacks. Many attacks utilize valid protocols or exploit open firewall ports used by web applications and other well-known services. This dashboard presents a detailed summary of network traffic detected by firewall devices and applications on the network.
Organizations routinely deploy web applications and services for business purposes that require specific firewall ports to be opened. Port exceptions allow traffic to pass through the firewall and provide access for end-users connecting from external resources. However, any ports left open can potentially be exploited and can allow an attacker to pivot inside the network. Once a host is compromised, attackers can easily collect and exfiltrate organizational data outside of the network for malicious purposes. Restricting services can help narrow down and eliminate any unnecessary firewall rules or open ports. Applying egress filtering to block all outbound traffic by default serves as a best practice to reduce the potential for data leakage. Monitoring network traffic will provide analysts with valuable information that can alert on and help prevent unauthorized traffic, potential misconfigurations, vulnerabilities, and malicious activity.
This dashboard provides a comprehensive summary of inbound and outbound firewall traffic on the network. Millions of event logs can be generated on a daily basis from firewall devices and applications. Components within this dashboard leverage the ability of the Tenable Log Correlation Engine (LCE) to monitor firewall event logs from a centralized location. Event data can alert analysts to inbound and outbound ports in use, as well as any unknown ports being used for malicious purposes. Information on protocol types can be useful in determining what services are being used. Firewall allowed and blocked events can provide specific device information on potential threats or attacks in progress. Information presented within this dashboard can be used to identify and eliminate potential blind spots and strengthen overall firewall policy configurations.
This dashboard is available in the SecurityCenter Feed, a comprehensive collection of dashboards, reports, Assurance Report Cards, and assets. The dashboard can be easily located in the SecurityCenter Feed under the category Monitoring. The dashboard requirements are:
- SecurityCenter 5.3.2
- LCE 4.8.0
Tenable automatically analyzes and provides information from active scanning, intelligent connectors, agent scanning, passive listening, and host data. Host data uses logs to correlate real-time events, monitor firewall traffic, and identify malicious attacks. Active scanning periodically examines hosts within the organization to determine overall risk. Intelligent connectors leverage event logs to improve context and analysis. Agent scanning enables organizations to rapidly assess hosts without the need for credentials. Passive listening detects hosts that were offline during active scans, and provides real-time information on host activity throughout the network. Each sensor provides organizations with the tools they need to proactively monitor and respond to threats within the enterprise.
The following components are included in this dashboard:
- Firewall Activity – Firewall Traffic: The Firewall Traffic chart presents a trend of allowed and blocked firewall events over the last seven days. The Allowed trend line events report on the “connection” event type and are filtered by “Allowed” and “Accepted” normalized events. The Blocked trend line events report on the “firewall” event type and include “Blocked”, “Deny”, “Rejected”, and “Drop” normalized events. Detected events include activity from IDS/IPS, web application firewalls, host-based firewalls, and firewall appliances whose logs are being forwarded to the LCE.
- Firewall Traffic - Firewall Connections: The Firewall Connections matrix displays firewall allowed and blocked event indicators across TCP, UDP, ICMP, and Unknown protocols. Event data can help analysts identify ports being used within applications or services, as well as any unknown ports being used for malicious purposes. This information can also indicate that systems are being “pinged” by internal applications or malicious outsiders for reconnaissance purposes. Analysts can drill down and set the tool to Port Summary or Raw Syslog Events to obtain additional information on the specific events.
- Firewall Traffic - Allowed Firewall Events: The Firewall Events table presents a list of allow events reported by firewall devices and services over the last 72 hours. Normalized events are filtered to include only “Allowed” and “Accepted” firewall events. Analysts can use the information presented within this component to quickly identify and remediate firewall blind spots, as well as strengthen existing firewall policies. This information can be filtered to include additional or specific normalized events per organizational requirements.
- Firewall Traffic - Network Traffic Events: The Network Traffic Events matrix presents indicators of Inbound, Internal, and Outbound network traffic over the last 24 hours. Indicators will alert analysts to network traffic reported by devices such as IDS/IPS, firewalls, host-based firewalls, and mail servers whose logs are being forwarded to the LCE. The component leverages several normalized events that are filtered by traffic flow. Clicking on an indicator will bring up the analysis screen, and setting the tool to Raw Syslog Events will display additional information on the specific event.
- Firewall Traffic - Inbound Firewall Port Summary: The Inbound Firewall Port Summary presents a list of the top five inbound ports in use on the network. Inbound network activity presented within this component may alert analysts to encrypted sessions, partial connections, inbound attacks, and potentially compromised hosts. Additional activity may also include hosts that accept external connections, which may indicate remote access services enabled on critical or internet-facing hosts. Analysts can drill down to obtain additional information about the normalized events, ports, IP addresses, and more.
- Firewall Traffic - Outbound Firewall Port Summary: The Outbound Firewall Port Summary presents a list of the top five outbound ports in use on the network. Outbound network activity may indicate remote access sessions, login failures, data leakage, and malicious port connections. Information presented within this component by may useful in identifying compromised hosts or other types of malicious activity. Analysts can drill down to obtain additional information about the normalized events, ports, IP addresses, and more.