by Stephanie Dunn
December 9, 2016

Monitoring the network for asset changes, software installations, and existing security policies can be an overwhelming task for any organization to manage effectively. Transient assets such as laptops, mobile phones, and virtualized systems can be missed by scans, and allow for rogue devices to infiltrate the network. Failure to continuously monitor network assets and software changes can add additional vulnerabilities and increase risk for the organization. This dashboard covers key concepts within the ITSG-33 guide that monitor for asset changes, software installations, and the status of existing security controls.
The Communications Security Establishment Canada (CSEC) developed a series of guidelines for security practitioners in managing information technology (IT) security risks for Government of Canada (GC) information systems. The Information Technology Security Guidance Publication 33 (ITSG-33), IT Security Risk Management: A Lifecycle Approach provides a comprehensive set of security controls that can be used to support a wide variety of business requirements. To support interoperability needs, the ITSG-33 guide is consistent with controls published in the U.S. National Institute of Standards and Technology (NIST) Special Publication 800-53 catalog. Data presented within this dashboard aligns with ITSG-33 security controls that support change management controls, monitoring asset inventory, and maintaining control over software installations. This dashboard aligns with the following controls:
- Configuration Change Control (CM-3)
- Least Functionality (CM-7)
- Information Systems Component Inventory (CM-8)
- User-Installed Software (CM-11)
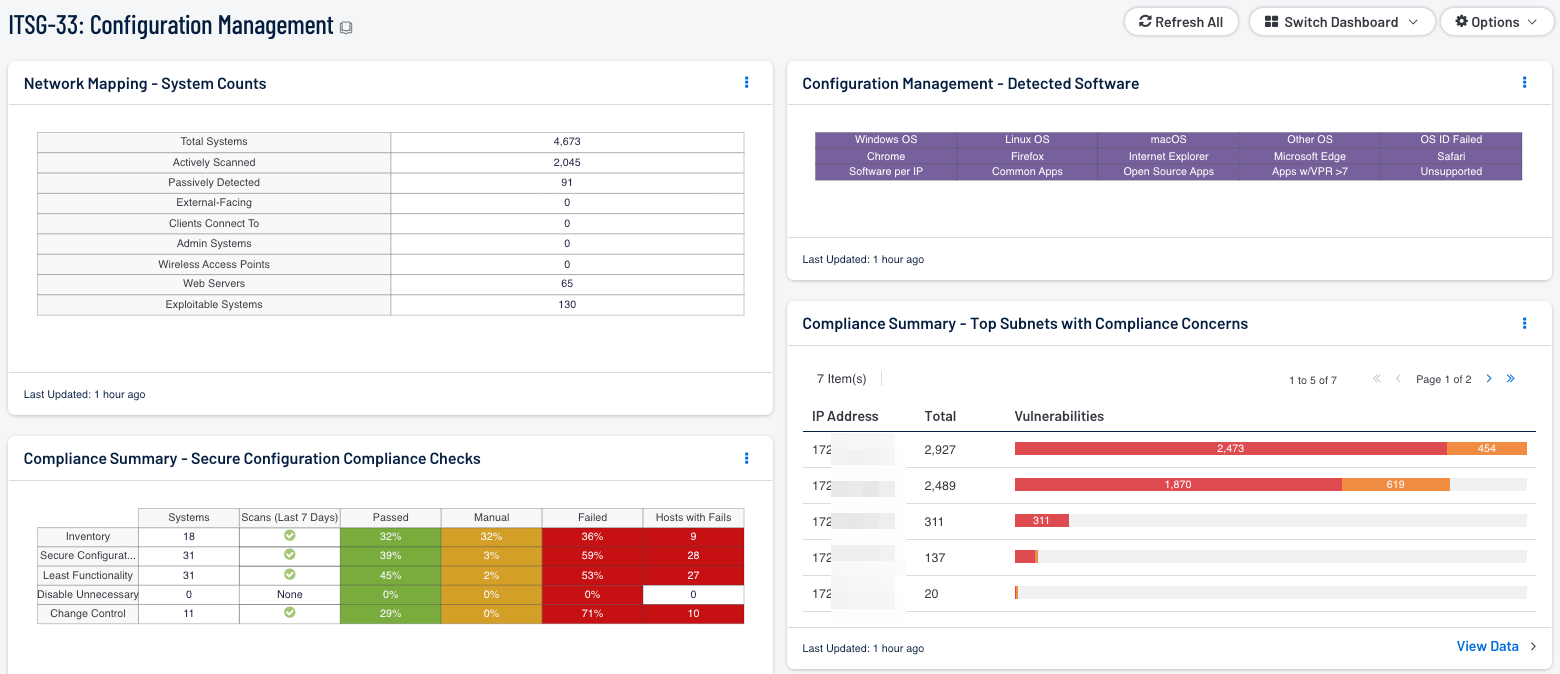
This dashboard provides an overview of system counts, newly detected MAC addresses, installed software, configuration issues and other changes throughout the network. Having an accurate and up-to-date count of existing assets on the network will assist analysts in preventing unauthorized devices to connect to the network. Monitoring asset changes will also help security teams to identify blind spots that may have been previously overlooked.
Organizations will be able to keep track of operating systems and software deployments. This information will enable organizations to gain control over software licenses, and reduce unnecessary costs. Information on software installations will highlight unauthorized and unsupported software running on network assets. Audit checks will monitor the status of existing security controls on network assets, and whether the security policies in place are effective. Monitoring changes across infrastructure devices, user accounts, and software will help to identify and prevent unauthorized modifications that could negatively impact critical systems.
This dashboard is available in the Security Center Feed, a comprehensive collection of dashboards, reports, Assurance Report Cards, and assets. The dashboard can be easily located in the Security Center Feed under the category Compliance & Configuration Assessment. The dashboard requirements are:
- Security Center 5.4.1
- Nessus 8.5.1
- NNM 5.9.0
Tenable Security Center is the market-defining continuous network monitoring solution, and can assist in securing an organization’s internal network. Security Center is continuously updated with information about advanced threats, zero-day vulnerabilities, and new regulatory compliance data. Active scanning periodically examines systems to determine vulnerabilities and compliance concerns. Agent scanning enables scanning and detection of vulnerabilities on transient and isolated devices. Passive listening provides real-time discovery of vulnerabilities on operating systems, browsers, desktop applications, wireless devices, and critical infrastructure. Host data and data from other security products is analyzed to monitor the network for changes on infrastructure devices, user accounts, and software installations. Security Center provides an organization with the most comprehensive view of the network and the intelligence needed to secure and protect assets within the network.
The following components are included within this dashboard:
- Network Mapping - System Counts: This table presents the top Class C subnets with the most compliance concerns. High severity indicates compliance failures, and medium severity indicates compliance advisories or checks that must be performed manually. The table is ordered so the subnet with the most compliance concerns is at the top. This information will help an analyst to identify which subnet needs the most attention in terms of compliance.
- Configuration Management - Detected Software: This matrix presents indicators that detect operating systems, browsers, unsupported, and other software installations on systems within a network. Indicators will turn purple when a match is found, and display a list of detected software. Analysts will find this information useful in tracking software licenses, and identify hosts running unauthorized or malicious software. Additionally, the data provided within this component can be used to monitor systems running unsupported software, which can contain vulnerabilities and place critical systems at risk.
- Compliance Summary - Secure Configuration Compliance Checks: This component presents the results of compliance audits to verify the secure configuration of systems, including inventory, secure configuration, least functionality, disabling unnecessary services, and change control. Each row includes the system count, whether scans were performed in the last seven days, and the percentage of checks that passed, failed, or require manual verification. Passed checks are displayed in green, failed checks are in red, and checks that require manual verification are in orange.
- Compliance Summary - Top Subnets with Compliance Concerns: This table presents the top Class C subnets with the most compliance concerns. High severity indicates compliance failures, and medium severity indicates compliance advisories or checks that must be performed manually. The table is ordered so the subnet with the most compliance concerns is at the top. This information will help an analyst to identify which subnet needs the most attention in terms of compliance.