by Stephanie Dunn
August 22, 2017

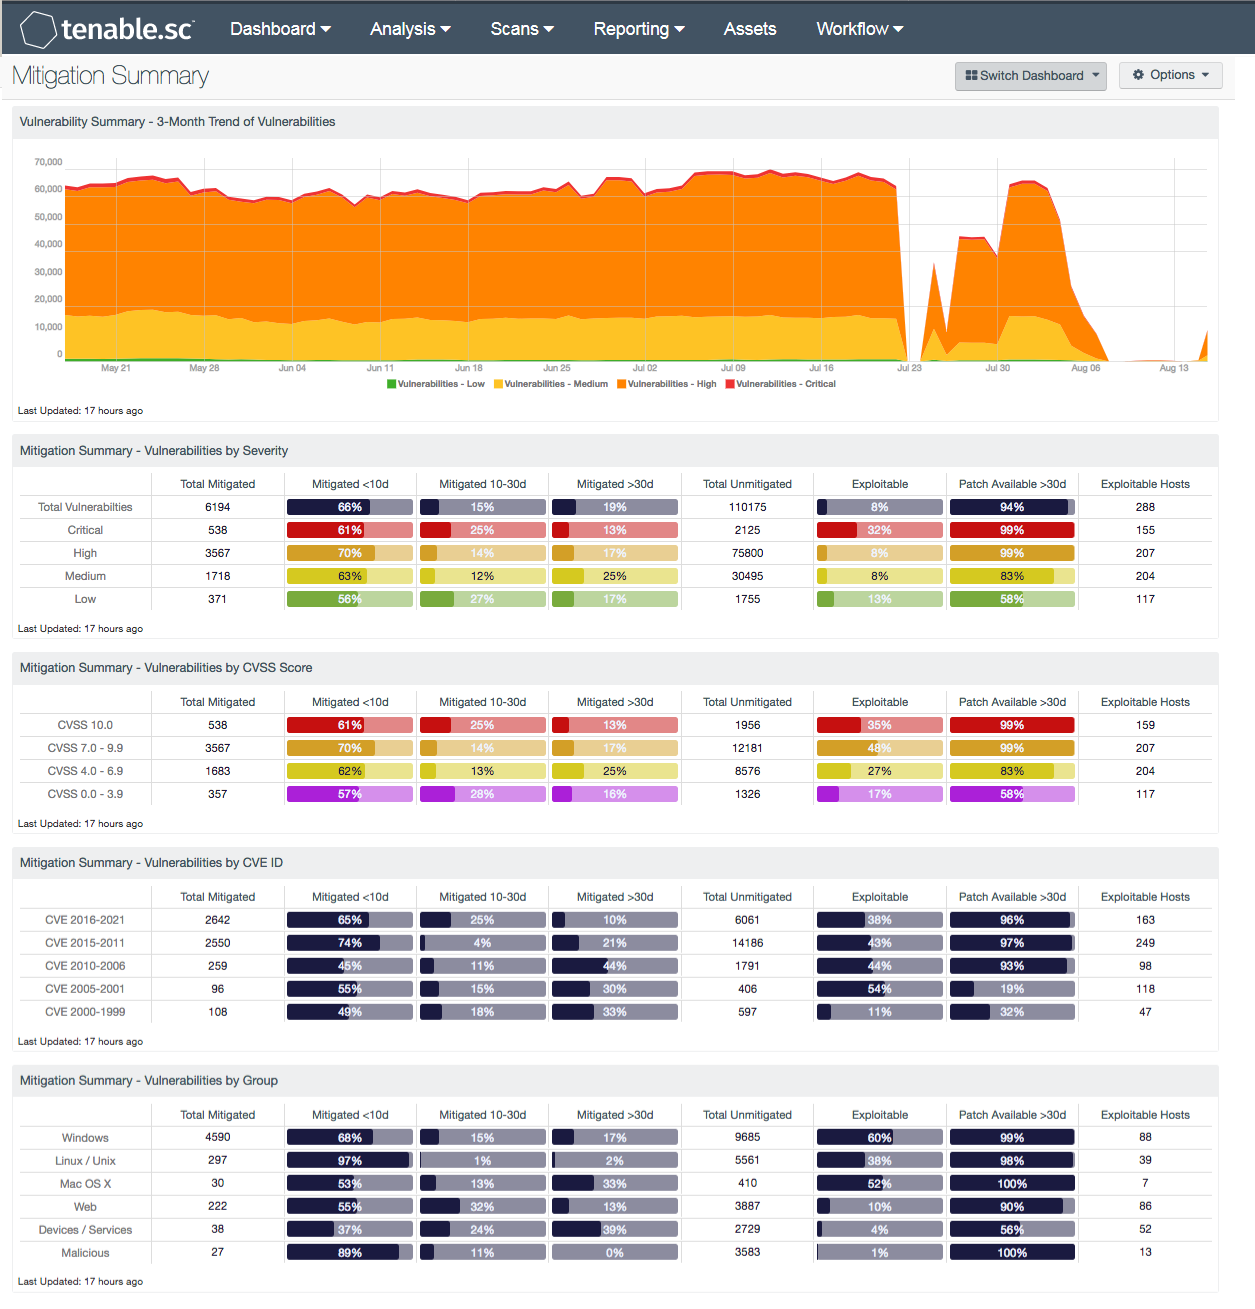
To mitigate risks within the enterprise, many organizations use a combination of manual and automated solutions to deploy patches. Unfortunately, many organizations do not have an effective plan in place for prioritizing, testing, and deploying patches. This issue can result in organizations falling behind in their patch cycle and leave critical systems at risk. This dashboard provides a high-level overview of current and mitigated vulnerabilities that will enable security teams to quickly assess security risks and prioritize patch management efforts.
Not knowing what patches need to be installed can result in a large number of patches overwhelming the network, resulting in multiple patch failures. The longer a system remains unpatched, the more time attackers have to exploit a vulnerability and gain access to the network. Tenable's Tenable.sc Continuous View® provides an in-depth examination of vulnerabilities that will accurately assess and help reduce cyber risk. Security teams can use this information to accurately measure current compliance statuses, track patch management efforts, and target critical systems. Executives can also easily drill down and communicate the status of the organization’s Cyber Exposure to the C-Suite.
This dashboard presents a summary of current and mitigated vulnerabilities over a set time period. Trend charts provide a complete look at vulnerabilities by severity, which can highlight the effectiveness of patch management efforts. Indicators using Common Vulnerability Scoring System (CVSS) scores are presented that will enable analysts to identify and address the most vulnerable hosts first. For each row, the CVSS scores correspond to the Tenable severity levels as follows:
- 10.0 = Critical severity
- 7.0-9.9 = High
- 4.0-6.9 = Medium
- 0.0-3.9 = Low
Vulnerabilities by Common Vulnerabilities and Exposures Identifiers (CVE ID) are filtered based on CVE prefix or year assigned. The most recent CVE IDs are presented at the top and can be filtered based on organizational requirements. Vulnerability data is also presented by operating system(s), device(s), service(s), and malicious processes that have been detected. Filters are used to group vulnerabilities based on plugin family. Each column includes the total number of mitigated vulnerabilities and the percentage of mitigated vulnerabilities within the specified number of days. For unmitigated vulnerabilities, the percentage of the unmitigated, exploitable vulnerabilities that have had a patch available for more than 30 days is also included. Using this information, organizations will obtain actionable information that can be used to track patch management efforts and identify the biggest risks across the entire enterprise.
This dashboard is available in the Tenable.sc Feed, a comprehensive collection of dashboards, reports, Assurance Report Cards, and assets. The dashboard can be easily located in the Tenable.sc Feed under the category Threat Detection & Vulnerability Assessments. The dashboard requirements are:
- Tenable.sc 5.5.0
- Nessus 8.5.1
- Nessus Network Monitor 5.9.0
Tenable's Tenable.sc Continuous View® (Tenable.sc CV™) is the market-defining continuous network monitoring solution, which assists organizations in tracking vulnerabilities within the enterprise. Tenable.sc CV™ is continuously updated with information about advanced threats, zero-day vulnerabilities, and new forms of regulatory compliance. Active scanning periodically examines systems to determine vulnerabilities and compliance concerns. Agent scanning enables scanning and detection of vulnerabilities on transient and isolated devices. Passive listening provides real-time discovery of vulnerabilities on operating systems, protocols, network services, wireless devices, web applications, and critical infrastructure. Tenable.sc CV™ provides an organization with the most comprehensive view of the network and actionable information to support mitigation efforts and reduce cyber risk.
The following components are included within this dashboard:
- Vulnerability Summary - 3-Month Trend of Vulnerabilities: This component is a 3-month summary chart tracking unmitigated vulnerabilities of low, medium, high, and critical severity.
- Mitigation Summary - Vulnerabilities by Severity: This matrix presents vulnerability summary information by severity.
- Mitigation Summary - Vulnerabilities by CVSS Score: This matrix presents vulnerability summary information by Common Vulnerability Scoring System (CVSS) score. CVSS is an open industry standard for assessing the severity of computer system security vulnerabilities; it attempts to establish a measure of how much concern a vulnerability warrants, compared to other vulnerabilities, so efforts can be prioritized.
- Mitigation Summary - Vulnerabilities by CVE ID: This matrix presents vulnerability summary information by Common Vulnerabilities and Exposures (CVE) identifier. The CVE system is a dictionary of publicly known information security vulnerabilities and exposures in publicly released software packages. Each CVE identifier begins with a year; in the matrix, the identifiers are grouped in 5 year blocks.
- Mitigation Summary - Vulnerabilities by Group: Nessus and NNM use many different plugins to discover vulnerabilities on various network systems and devices. This matrix presents vulnerability summary information by groups of related Nessus and NNM plugins, such as all Windows plugins, all Linux/Unix plugins, etc.