by Josef Weiss
October 31, 2022

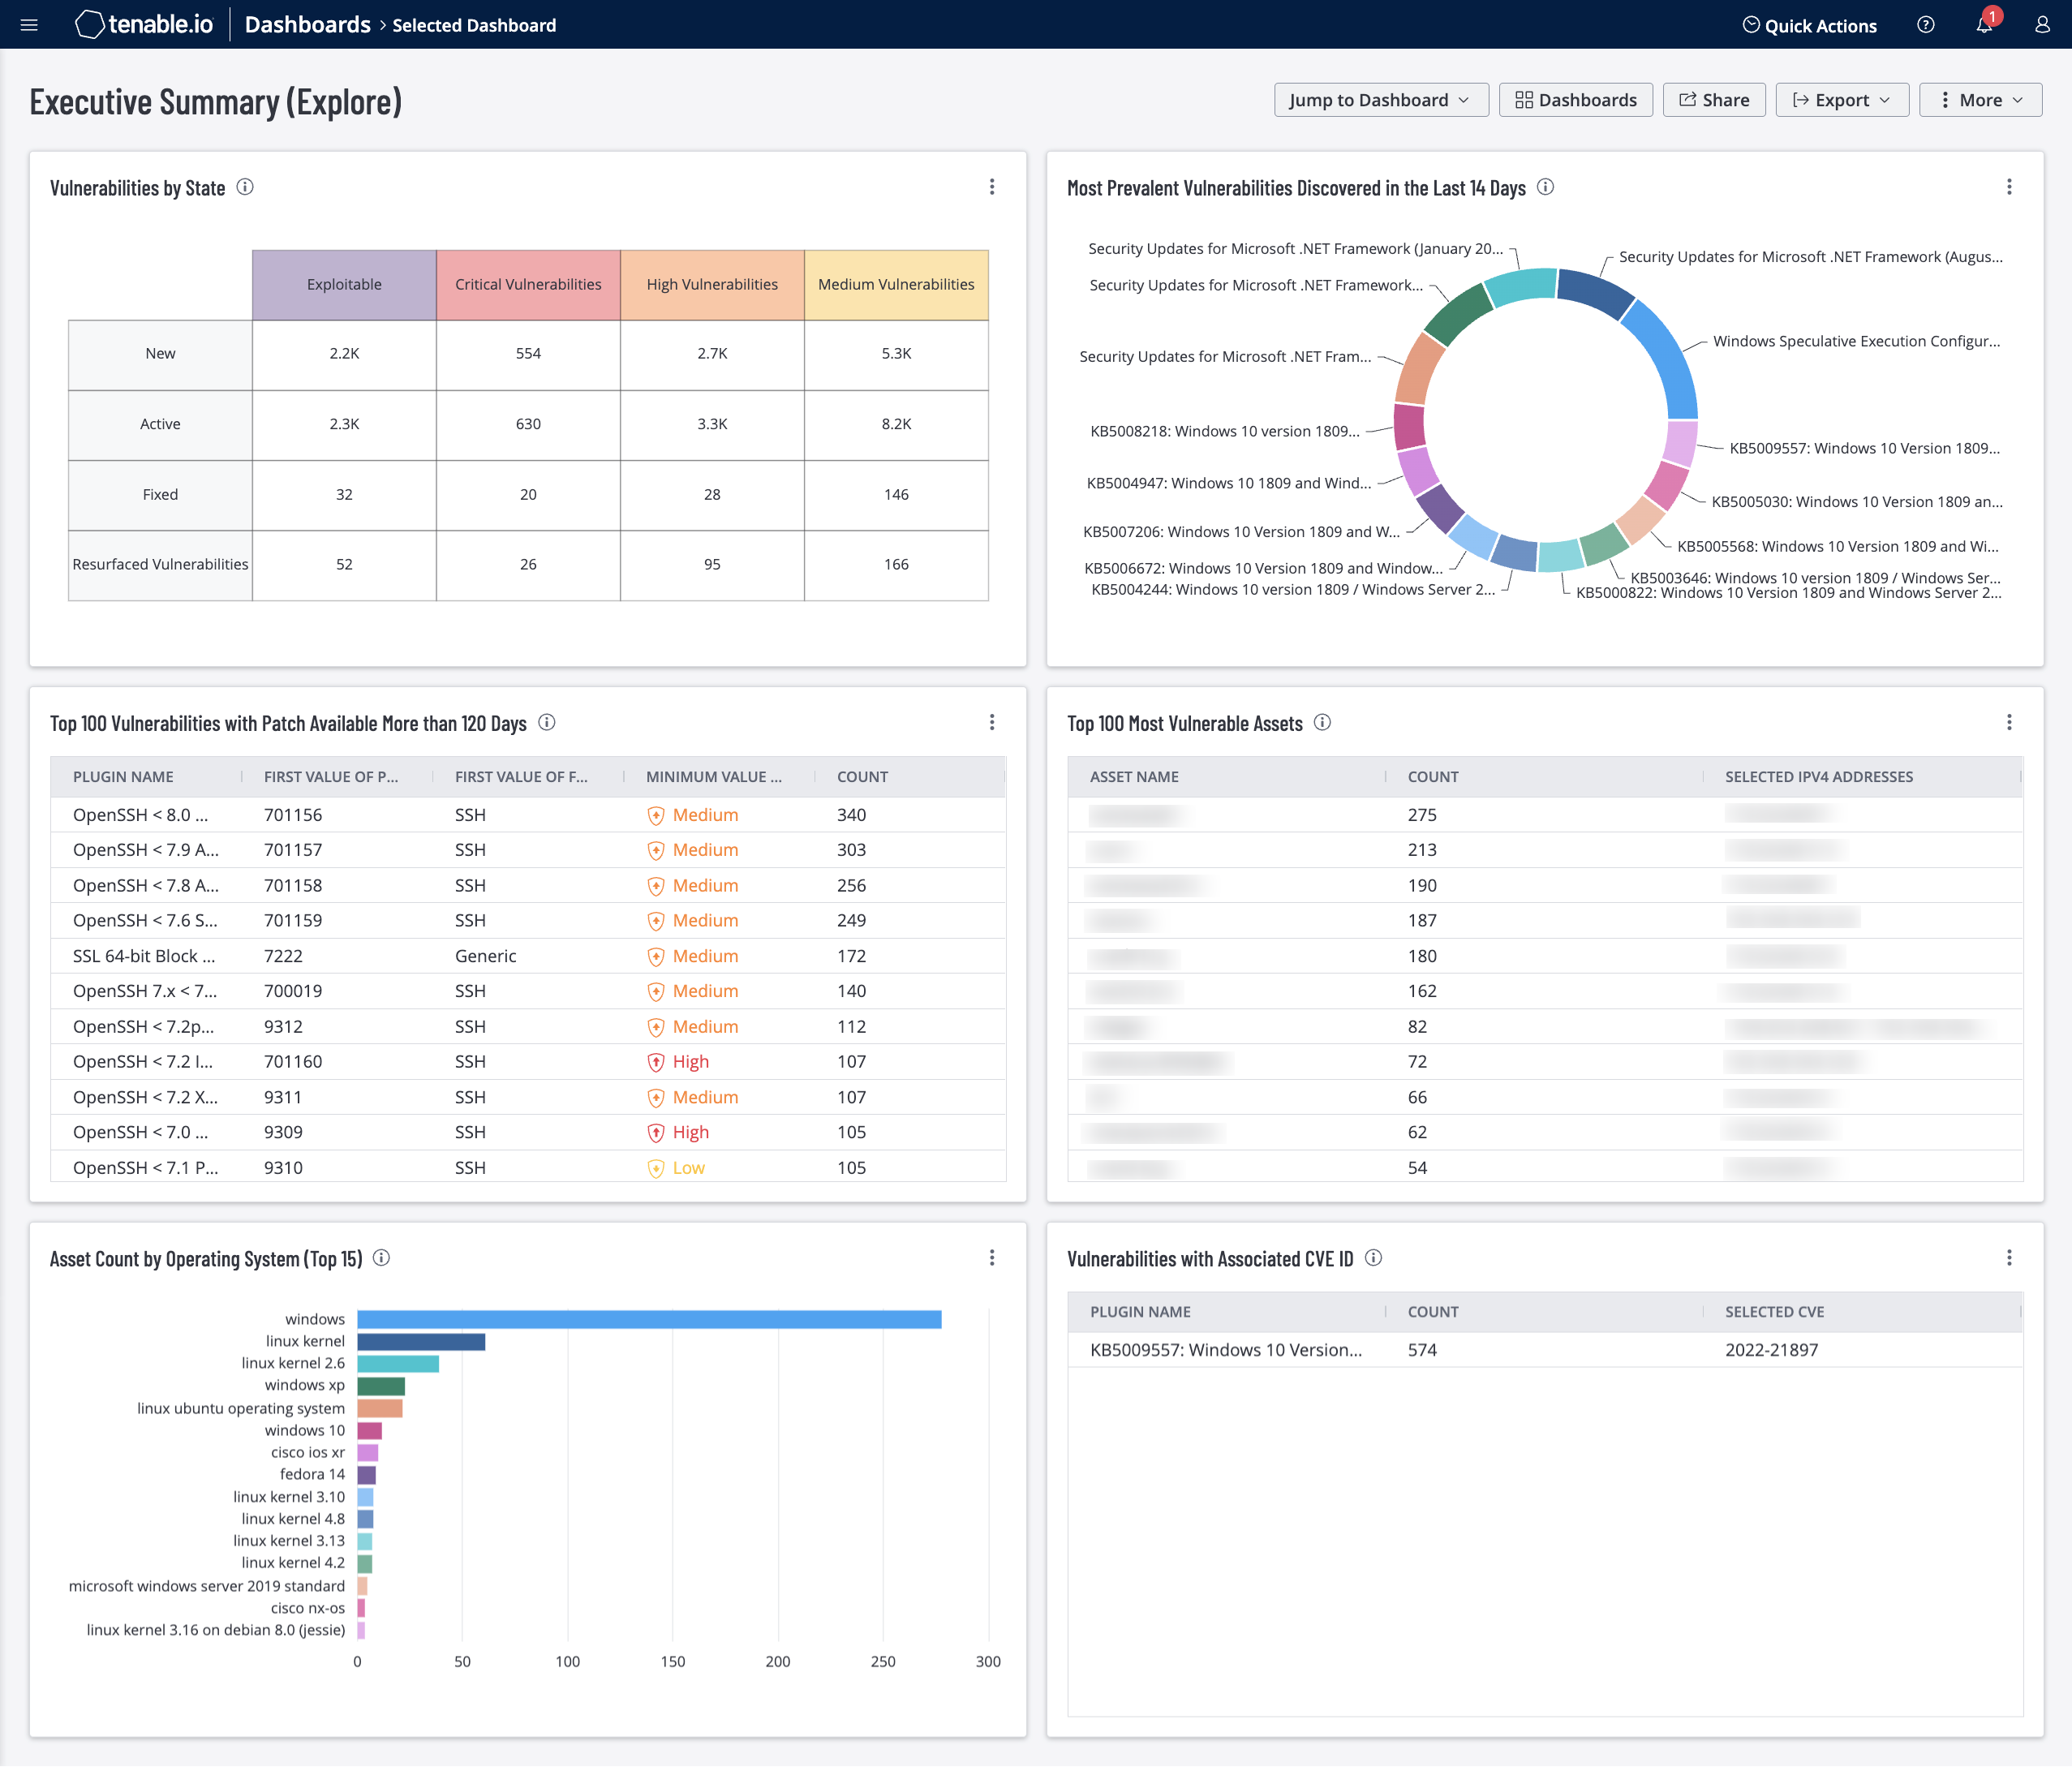
Monitoring the current state of an organization's Cyber Exposure initiative and measuring the organization's cyber risk are key responsibilities of security analysts. Security analysts can leverage Common Vulnerabilities and Exposures (CVE) metrics, vulnerability state and other high-level metrics, to provide security management information that identifies which steps in the life cycle need attention or are missing altogether. This dashboard consolidates several of these key metrics to identify and measure cyber risk.
There are metrics for five severity levels: Information, Low, Medium, High and Critical. Information has no risk associated with the finding, and only provides information for an analyst. Low through Critical severities are based on the Common Vulnerability Scoring System (CVSS) score. CVSS scores capture the principal characteristics of a vulnerability and produce a numerical score, which is translated into a severity. Although a vulnerability's severity score is based on CVSS, other considerations, such as additional mitigations may warrant assigning the vulnerability a higher or lower severity. Tenable.io uses both quantitative (CVSS Score) and qualitative (severity) information about an organization's vulnerabilities in a comprehensive view.
The CVE List is a data structure that contains vulnerability identification information. CVEs allow many security products and software companies to report a common vulnerability. Once a vulnerability is reported, plugins are created for Tenable.io to detect the vulnerability. When high visibility vulnerability exploitation occurs, such as Log4j , executives may ask 'Are we vulnerable to CVE-2021-44228?' Tenable.io is an essential platform for reporting on CVE metrics.
The 'vulnerability state' metric is native to Tenable.io. This metric reports on the status of a vulnerability. There are four states: New, Active, Fixed and Resurfaced. The state New indicates vulnerabilities that were first detected on assets within the last 14 days. The Active state indicates vulnerabilities that are currently present on the network and are causing increased risk. The Fixed state indicates vulnerabilities that are no longer present. A vulnerability in the Resurfaced state indicates that the vulnerability has returned. This means that Tenable.io detected that at some point the vulnerability was present, then removed (Fixed) and has now returned. This could be due to a scanning issue, or software that was reinstalled or downgraded.
Security leaders need to SEE everything, PREDICT what matters most and ACT to address cyber risk and effectively align cybersecurity initiatives with business objectives. Tenable.io discovers and analyzes assets continuously to provide an accurate and unified view of an organization’s security posture. The requirements for this dashboard are: Tenable.io Vulnerability Management (Nessus, NNM).
Widgets
- Vulnerabilities by State – This widget provides a view into the vulnerability life cycle. Tracking vulnerabilities through each state demonstrates the progress of risk mitigation efforts. Each column represents an elevated level of risk. The first column, Exploitable, shows the count of vulnerabilities that are known to be exploitable regardless of severity. The next three columns show vulnerability counts based on severity. The requirements for this widget are: Tenable.io Vulnerability Management (Nessus, NNM).
- Most Prevalent Vulnerabilities Discovered in the Last 14 Days – This widget provides a summary view of the most prevalent medium, high and critical severity vulnerabilities that have been detected within the last 14 days. The filters in this widget use the vulnerability state to identify new vulnerabilities. The requirements for this widget are: Tenable.io Vulnerability Management (Nessus, NNM).
- Top 100 Vulnerabilities with Patch Available More than 120 Days – This widget provides a list of vulnerabilities that have had patches available for over 120 days. The filter 'Patch Published' tracks when a patch was released by the software vender. The date range of 120 days was selected to fall within a normal patch cycle of 90 days, with a 30 day scan buffer. If this table is always full, there could be a problem with the patch deployment process. Vulnerabilities shown in this table provide organizations a reference point to update mitigation strategies. The requirements for this widget are: Tenable.io Vulnerability Management (Nessus, NNM).
- Top 100 Most Vulnerable Assets – This widget presents a list of the top most vulnerable assets at risk for exploitation. Information is filtered by vulnerabilities of high or critical severity that are exploitable, and is sorted by total vulnerabilities. This data on detected vulnerabilities enables analysts to prioritize remediation efforts. This widget identifies the top vulnerabilities to mitigate to reduce the organization's overall attack surface. The requirements for this widget are: Tenable.io Vulnerability Management (Nessus, NNM).
- Asset Count by Operating System (Top 15) – This widget displays the Top 15 Operating Systems, by asset count, that have been identified in the environment. Knowing the prevalence of operating systems in the environment enables security analysts to focus on mitigating vulnerabilities that will have the greatest impact on the attack surface. This information is pulled from the summary asset information that a Tenable.io scan has identified as the operating system installed on the asset. The requirements for this widget are: Tenable.io Vulnerability Management (Nessus, NNM).
- Vulnerabilities with Associated CVE ID – This widget provides a list of the top 100 vulnerabilities that have a Vulnerability Priority Rating (VPR) Score of 7.0 or higher. CVEs that are associated with these vulnerabilities are also displayed in the table. The table is sorted by count with the most prevalent vulnerabilities displayed at the top of the table. This widget provides organizations with a method to identify vulnerabilities by CVE Identifier. Since not all vulnerabilities have a CVE Identifier, all high-risk vulnerabilities are displayed. Those vulnerabilities without a CVE ID are identified with a NULL entry in the CVE column. The requirements for this widget are: Tenable.io Vulnerability Management (Nessus, NNM).