by Josef Weiss
February 20, 2025
Patch management is a key responsibility of any information security team. By applying patches regularly, security teams can reduce the level of risk that their organization is exposed to. Integrating Nessus with Tenable Vulnerability Management allows analysts to monitor the application of patches and resolution of vulnerabilities in their network.
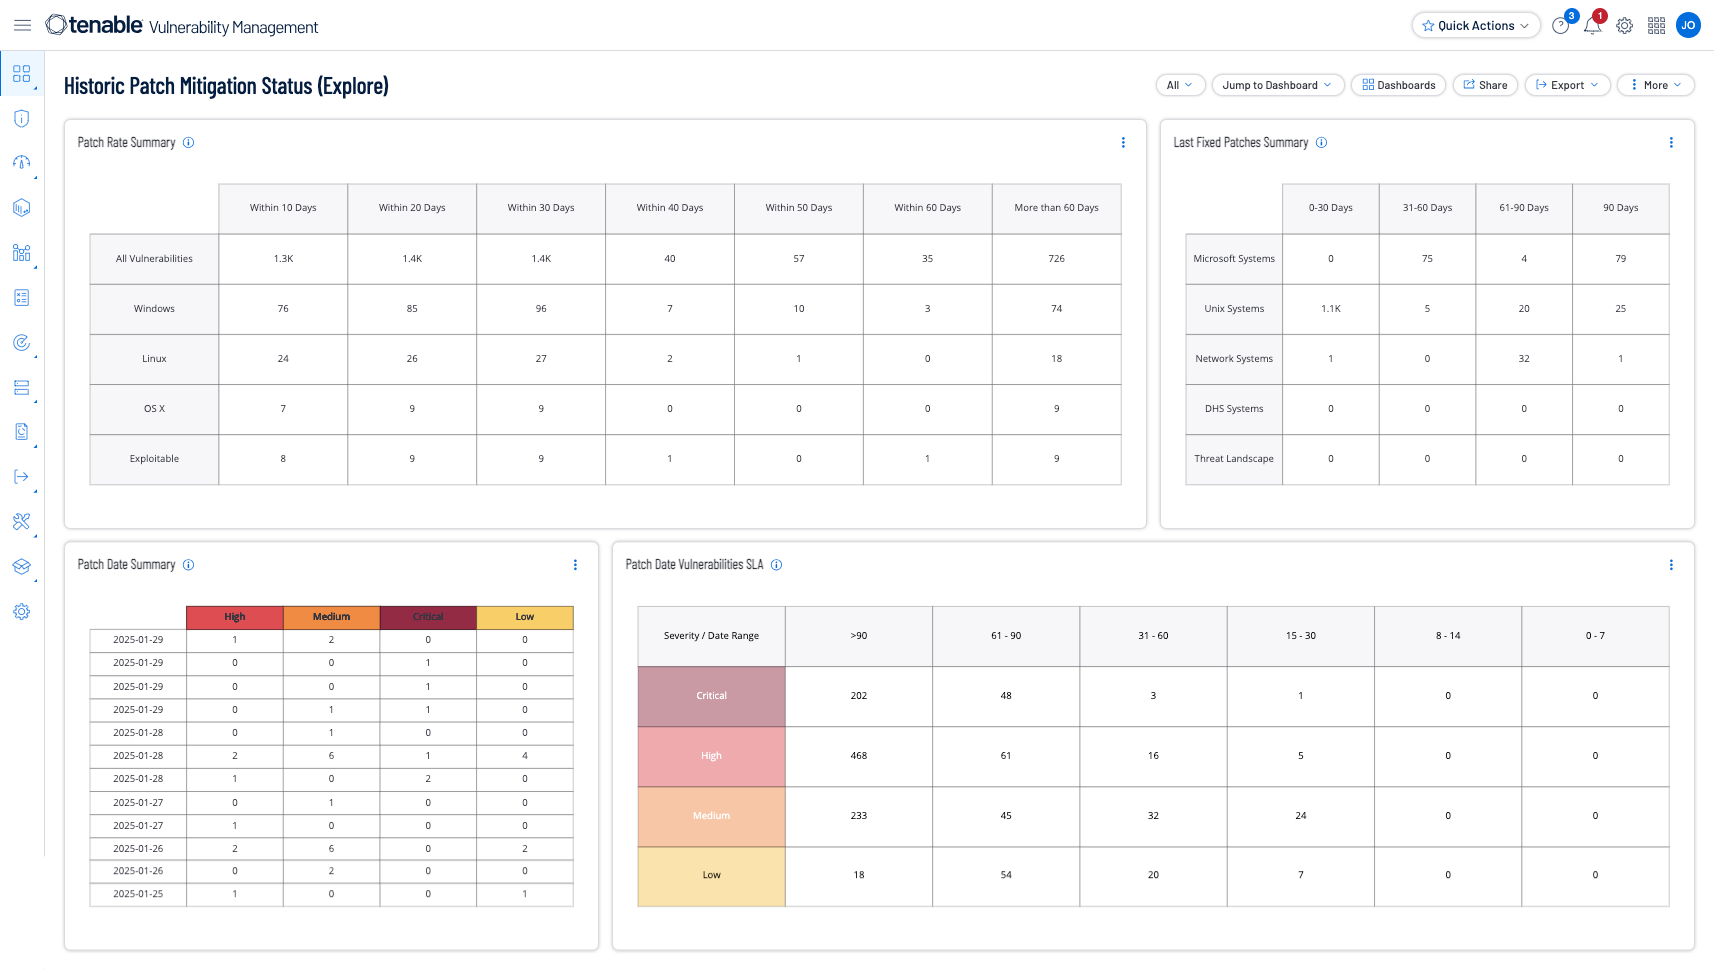
The Historic Patch Mitigation Status dashboard monitors vulnerability mitigation on an organization’s network in order to help security teams understand the effectiveness of their patch management efforts. Increased visibility into vulnerability mitigation can assist security teams in implementing improved patch application procedures as needed. By monitoring the patterns of patch application and vulnerability mitigation, security teams can better understand the effectiveness of their efforts and make adjustments as necessary in order to more effectively secure their network.
The widgets in this dashboard display data about the mitigation dates of detected vulnerabilities. Two filters are leveraged: “Time Taken To Fix” and “Last Fixed.” The widgets depicting patch rates use the “Time Taken To Fix” filter to count vulnerabilities that were fixed within the specified number of days of initial discovery. The widgets that depict patch dates use the “Last Fixed” filter to count vulnerabilities that were mitigated within the specified timeframe. Together, the widgets in this dashboard can assist security teams with understanding the effectiveness of their patch application and vulnerability remediation efforts.
Widgets
- Patch Rate Summary - The Patch Rate Summary widget displays host counts grouped by various time frames and plugin families.
- Last Fixed Patches Summary - The Last Fixed Patches Summary widget displays columns that contain counts of fixed vulnerabilities grouped by the last fixed dates of 0-30, 31-60, 61-90, and more than 90 days ago.
- Patch Date Summary - The Patch Date Summary widget is a dynamic matrix which is grouped by Severity (x axis) and Last Fixed (y axis).
Patch Date Vulnerabilities SLA - The Patch Date Vulnerabilities SLA widget allows organizations to track and report mitigation efforts over time and severity.