by Carole Fennelly
November 7, 2022

Information Security Managers often face a difficult choice of what problem to solve first. With operational commitments conflicting with security risks from software vulnerabilities, do they apply the patch or take some focus on operations? This dashboard helps managers understand prioritize vulnerabilities remediation.
If the main objective of patch management is to create a consistently configured environment that mitigates known vulnerabilities and cyber risks, then the purpose of a vulnerability management system is to identify the vulnerabilities and cyber risk need to be remediated or mitigated. The method of scanning statically deployed systems located within the borders of the network, is no longer sufficient. There is a gap in the way risks are detected, where they reside, and if they can be scanned.
Managers are often required to work within a change control program for mitigation strategies. As the size of the organization grows, so does the complexity of applying patches and mitigating risks. The change management program requires a lot of detailed information about the patch that is being applied, such as severity, CVE, and other related information. Managers are required to look for this information in multiple locations. Tenable.io uses this dashboard to correlate vulnerability information into a single location. The tables and charts in this dashboard provide the most critical vulnerabilities grouped using multiple metrics that matter most to managers.
Security leaders need to SEE everything, PREDICT what matters most and ACT to address cyber risk and effectively align cybersecurity initiatives with business objectives. Tenable.io discovers and analyzes assets continuously to provide an accurate and unified view of an organization’s security posture. The requirements for this widget are: Tenable.io Vulnerability Management (Nessus, NNM).
Widgets
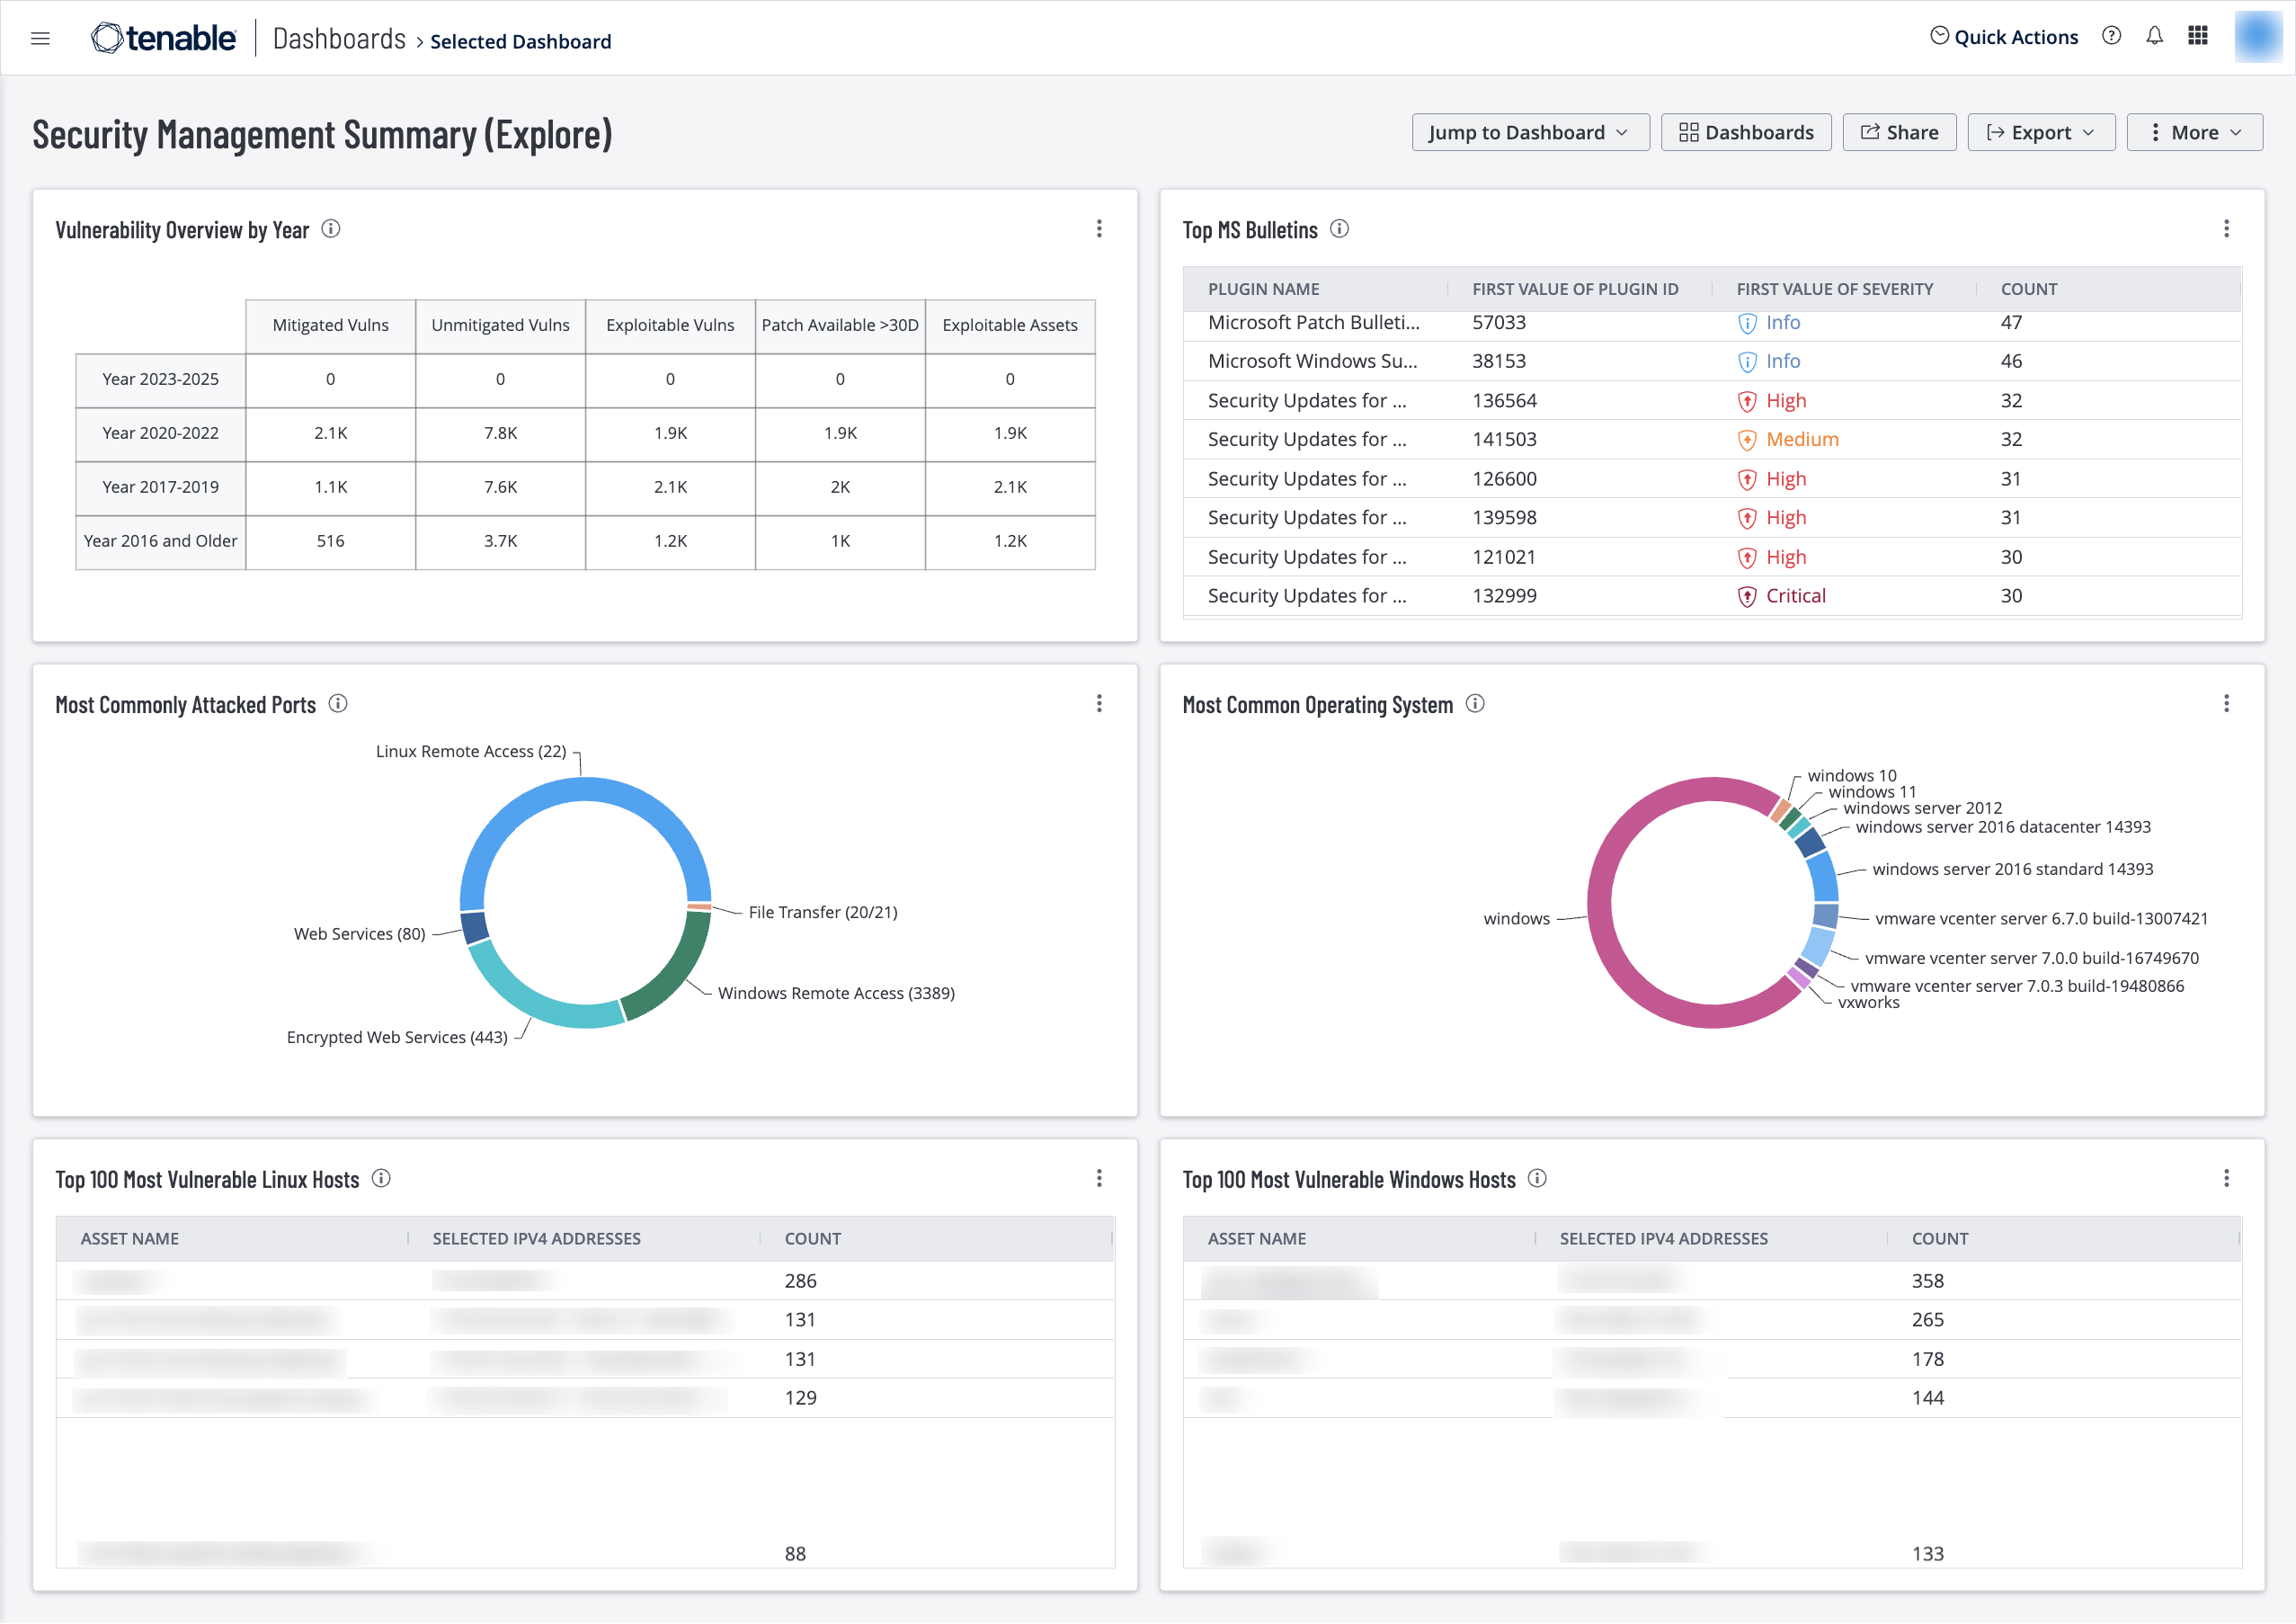
Vulnerability Overview by Year – This widget tracks vulnerability mitigations by year. Each row covers a time period. The bottom row displays vulnerabilities that were made public from 2016 and earlier. The ascending rows display vulnerabilities from more recent time periods, up to the current year. The Mitigated column displays the total number of mitigated vulnerabilities. The Unmitigated column displays the total number of vulnerabilities that have not yet been mitigated. The Exploitable column displays the number of those unmitigated vulnerabilities that are known to be exploitable. The Patch Available column displays the number of unmitigated, exploitable vulnerabilities that have had a patch available for more than 30 days. The Exploitable Assets column displays the number of assets on the network that have unmitigated, exploitable vulnerabilities. Drilling down into the widget provides more details about vulnerabilities discovered by this filter. This information demonstrates the effectiveness of the security program over time. If vulnerabilities from previous years are still present in the environment, security management needs to address why they are not mitigated. The requirements for this widget are: Tenable.io Vulnerability Management (Nessus, NNM).
Top MS Bulletins – This widget displays the number of vulnerabilities detected that are grouped by Microsoft Knowledge Base (KB) articles, Security Rollups, and Bulletin IDs. This information helps prioritize patch deployment efforts and provides direction to operation teams. The requirements for this widget are: Tenable.io Vulnerability Management (Nessus, NNM).
Most Commonly Attacked Ports – This widget displays a ring chart of the most commonly attacked ports. The widget is filtered using the port filter and displays which ports are most vulnerable. The requirements for this widget are: Tenable.io Vulnerability Management (Nessus).
Most Common Operating Systems – This widget displays a percentage of the different operating systems found within the environment. This information assists managers with task and remediation planning. The Top 10 most common operating systems are displayed in the chart, but this value can be edited based on local requirements. Managers can use this information to determine the mitigation effort required based on asset volume when creating remediation tasks. The requirements for this widget are: Tenable.io Vulnerability Management (Nessus, NNM).
Top 100 Most Vulnerable Linux Hosts – This widget displays the top twenty most vulnerable Linux systems, sorted by total vulnerabilities. This table provides a clear directive of vulnerability risk that enables operations teams to prioritize remediation by focusing on hosts with the most vulnerabilities. The requirements for this widget are: Tenable.io Vulnerability Management (Nessus, NNM).
Top 100 Most Vulnerable Windows Hosts – This widget displays the top ten most vulnerable Windows systems, sorted by total vulnerabilities. This host analysis assists managers in measuring risk and prioritizing remediation tasks. As remediation tasks are completed, this widget will continually display the most vulnerable Windows systems, even down to a low severity level. The requirements for this widget are: Tenable.io Vulnerability Management (Nessus, NNM).