by Cesar Navas
March 14, 2025
This Dashboard is in Beta and is not final. The Essential 8: Patch Applications & Patch Operating Systems Dashboard is designed to support organizations in implementing and monitoring the Essential Eight Strategies for mitigating cybersecurity risks. This comprehensive dashboard provides actionable insights into asset discovery, patch management, compliance, and exploitability to ensure a robust security posture across operating systems and applications. The Australian Cyber Security Centre (ACSC) under the Australian Signals Directorate (ASD) provides guidance to address targeted cybersecurity intrusions through its Strategies to Mitigate Cyber Security Incidents. Among these, the Essential Eight describes the minimum set of preventative cybersecurity measures organizations should implement. This guidance, complemented by the Information Security Manual (ISM) controls, forms a robust framework to ensure the confidentiality, integrity, and availability of information technology and operational technology systems. This dashboard aligns with these controls to provide critical insights into the implementation of the Essential Eight.
The Tenable One Platform combines a suite of sensors to facilitate efficient vulnerability scanning, regardless of network complexity. By leveraging Tenable's capabilities, organizations can effectively discover, assess, and understand their attack surface, gaining comprehensive insights into exposure points. This is coupled with Exposure Response features that prioritize remediation efforts based on contextual risk. The dashboard includes critical features to highlight asset discovery, identify unsupported systems, monitor patch management timelines, track compliance rates, and classify exploitable vulnerabilities, ensuring comprehensive coverage of the Essential Eight. To maximize relevance, organizations should leverage Asset Tagging (Tenable Vulnerability Management) or Dynamic Asset Lists (Tenable Security Center). This ensures that the dashboard can be filtered to focus on data critical to implementing the Essential Eight.
Tagging assets as Internet-facing or Non-Internet-facing enables differentiation for stricter service-level agreements (SLAs). For example, internet-facing systems require patching within 48 hours, while non-internet-facing systems have a longer patching window (e.g., two weeks). Asset tags, composed of Category:Value pairs (e.g., Connectivity:Internet-Facing), can be applied manually or automatically using filtering rules such as public IP ranges, open ports (e.g., 80, 443), or cloud metadata. This categorization simplifies monitoring and prioritization for Essential Eight compliance, ensuring that organizations address vulnerabilities in their most critical assets. Tagging by application risk level (e.g., High Risk, Low Risk) or system role further enhances visibility. For more details, refer to Tenable's Tagging Documentation. This dashboard combines Tenable's comprehensive vulnerability scanning, exposure insights, and asset prioritization with the ASD's Essential Eight Strategies. By using the dashboard in conjunction with ISM controls and asset tagging, organizations can enhance their cybersecurity maturity, address vulnerabilities more effectively, and ensure compliance with Australia's cybersecurity standards.
Widgets
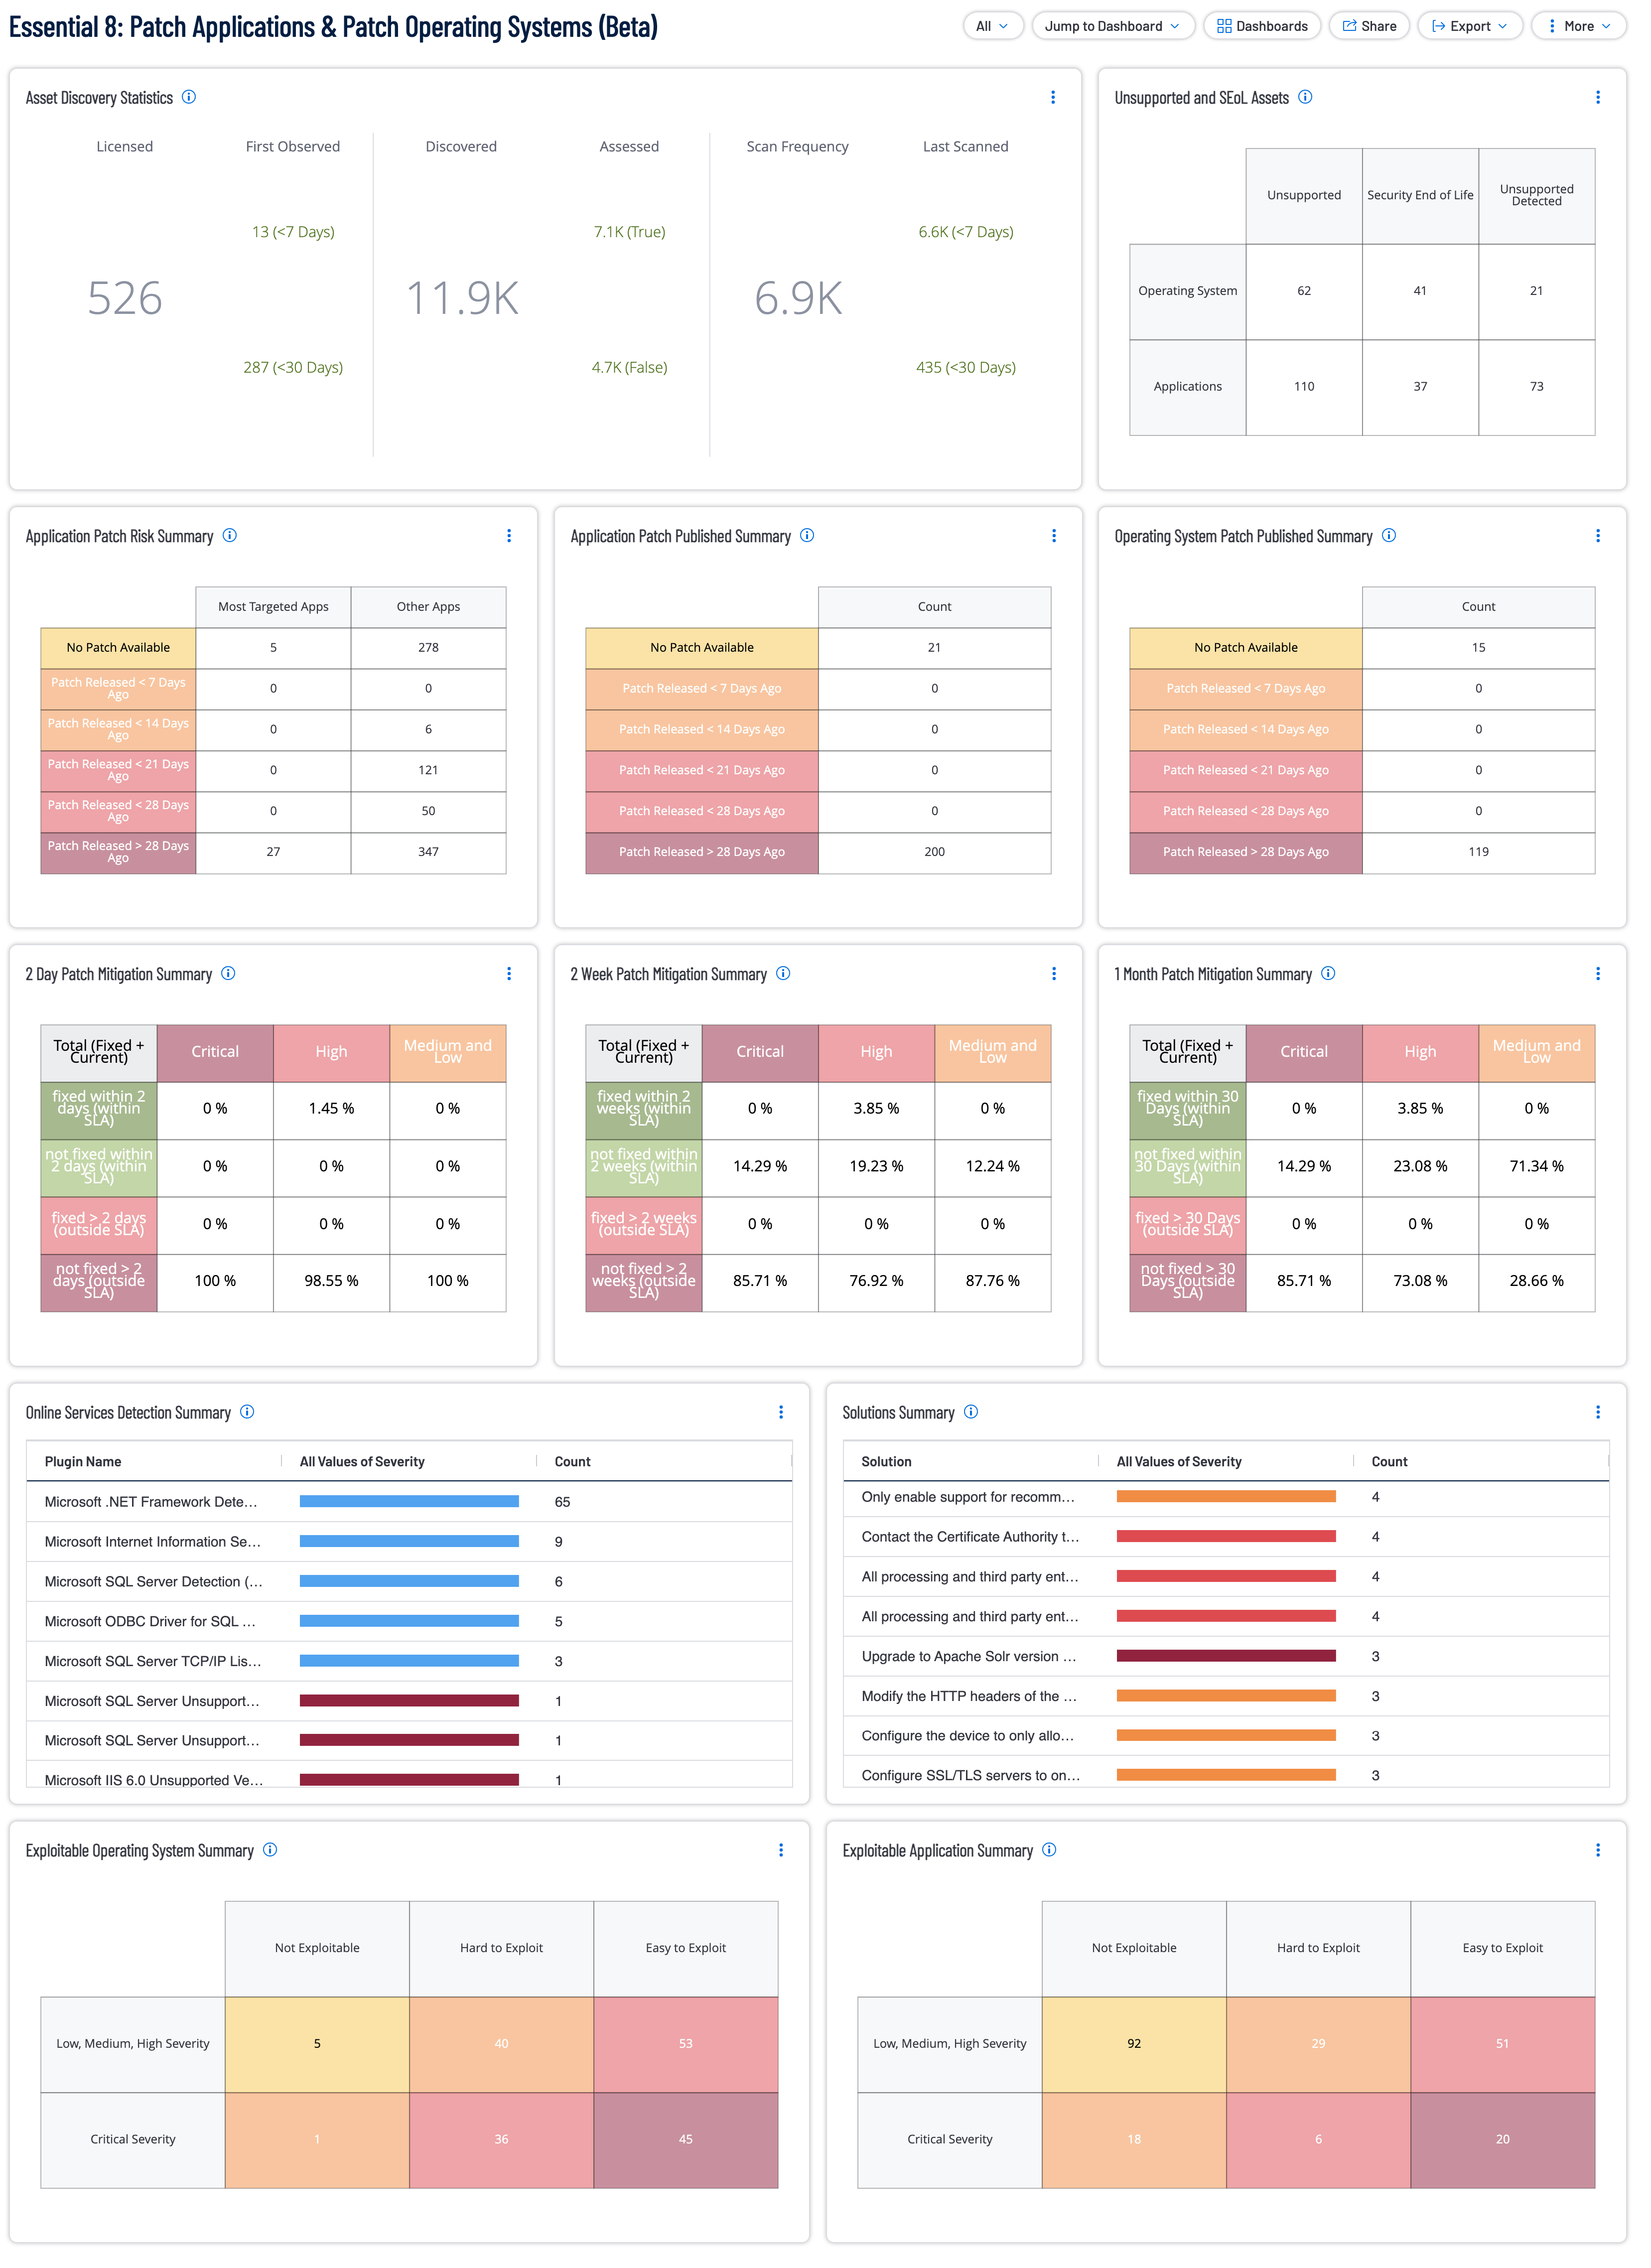
- Asset Discovery Statistics - The Asset Discovery Statistics (Explore) widget displays statistics for Tenable.io licensed assets that were first observed less than 7 days ago and less than 30 days ago. The Tenable.io licensed asset limit determines the number of assets that can be scanned for vulnerabilities. The first section displays the total number of licensed assets. The middle column displays the total number of newly discovered assets that are not counted against the license. The last column displays the number of licensed assets that were successfully authenticated with credentials and scanned. More license count details can be viewed on the License page in Settings in Tenable.io. Additionally, the widget is filtered to include four asset types; Host, Web Applications, Cloud Resources, and Domain Inventory.
- Unsupported and SEoL Assets - The Unsupported and SEoL widget displays assets counts by two categories, Operating System and Application. Assets within these categories are further broken down by products that are either unsupported, SEoL, or that have been detected as running an unsupported product. Knowing which operating systems or applications are unsupported or approaching end-of-life (EOL) can improve a security team's ability to mitigate vulnerabilities and secure the network. Assets running unsupported operating systems and applications are more vulnerable to exploitation. Identifying and upgrading unsupported operating systems and applications is essential to an effective security program.
- Application Patch Risk Summary - The Application Patch Risk Comparison widget provides a detailed analysis of application vulnerabilities by comparing patch availability and release timelines between 'Most Targeted Apps' and 'Other Apps.' For the 'Most Targeted Apps'column, the filter used is the CPE filter equaling to some common apps like: 'cpe:/a:microsoft:edge', 'cpe:/a:microsoft:office', and 'cpe:/a:microsoft:word' to name a few. The widget categorizes the data into six groups: applications with no patch available, those with patches released within 7, 14, 21, or 28 days, and those with patches released over 28 days ago. This visualization helps prioritize patch management efforts by highlighting the number of vulnerable applications in each category, emphasizing the urgency for securing the most targeted applications versus less critical ones.
Application Patch Published Summary - The 'Application Patch Availability' widget provides a breakdown of patch release timelines for applications categorized by their patch availability status. The widget highlights the total count of applications with no patch available, as well as those with patches released within 7, 14, 21, or 28 days, and over 28 days ago. This data helps identify the urgency of addressing vulnerabilities in applications, prioritizing those with delayed or unavailable patches to mitigate security risks effectively.
Operating System Patch Published Summary - The 'Operating System Patch Timeliness' widget displays a detailed distribution of patch release statuses for operating systems. The widget categorizes the number of systems with no patch available and systems with patches released at intervals of less than 7, 14, 21, or 28 days, as well as those released over 28 days ago. This widget enables organizations to assess the timeliness of patch deployment for operating systems, aiding in strategic patch management to ensure system security and compliance.
2 Day Patch Mitigation Summary - The 2-Day Compliance Overview widget provides a detailed summary of vulnerability management within a two-day timeline. The widget categorizes vulnerabilities by their severity, Critical, High, and Medium and Low, and tracks their resolution status.The first row represents vulnerabilities that have been fixed within SLA. The second row represents vulnerabilities that have not been fixed, but is still within SLA therefor it acts as a sort of grace period row. The third row represents vulnerabilities that have been fixed outside of SLA. The last row represents vulnerabilities that have not been fixed and is currently outside SLA. This widget helps assess immediate remediation efforts and pinpoint gaps in vulnerability resolution.
2 Week Patch Mitigation Summary - The 2-Week Compliance Overview widget offers an in-depth analysis of vulnerabilities managed over a 14-day timeline. The widget classifies vulnerabilities by severity, Critical, High, and Medium and Low, and provides insights into their resolution progress. The first row represents vulnerabilities that have been fixed within SLA. The second row represents vulnerabilities that have not been fixed, but is still within SLA therefor it acts as a sort of grace period row. The third row represents vulnerabilities that have been fixed outside of SLA. The last row represents vulnerabilities that have not been fixed and is currently outside SLA. This widget is a vital tool for monitoring medium-term remediation performance and identifying outstanding security risks.
1 Month Patch Mitigation Summary - The 1 Month Compliance Overview widget offers an in-depth analysis of vulnerabilities managed over a 14-day timeline. The widget classifies vulnerabilities by severity, Critical, High, and Medium and Low, and provides insights into their resolution progress. The first row represents vulnerabilities that have been fixed within SLA. The second row represents vulnerabilities that have not been fixed, but is still within SLA therefor it acts as a sort of grace period row. The third row represents vulnerabilities that have been fixed outside of SLA. The last row represents vulnerabilities that have not been fixed and is currently outside SLA. This widget is a vital tool for monitoring medium-term remediation performance and identifying outstanding security risks.
Online Services Detection Summary - The Online Services Detection Summary widget provides an overview of vulnerabilities identified in online services based on plugin detections. The widget lists plugins by name, categorizes their severity levels, and displays the total count of detections for each. This widget offers insights into the most frequently detected vulnerabilities, allowing organizations to prioritize addressing high-severity issues and gain a clear understanding of their online service risk landscape.
Solutions Summary - The Solutions Summary widget highlights recommended remediation steps for identified vulnerabilities, grouped by solution type and severity. The widget lists specific solutions, such as updating packages or applying security updates, along with the count of vulnerabilities each solution addresses. This widget enables organizations to focus on actionable fixes, streamline their remediation efforts, and prioritize solutions that address the most critical vulnerabilities.
Exploitable Operating System Summary - The Exploitable Operating System Summary widget provides a detailed breakdown of vulnerabilities in operating systems based on their severity (Low, Medium, High, and Critical) and exploitability ease. Exploitability is determined using the CVSSv3 Attack Complexity metric, where vulnerabilities with 'High' complexity are categorized as 'Hard to Exploit,' and others are labeled as 'Easy to Exploit.' The widget also identifies vulnerabilities that are 'Not Exploitable.' This matrix enables organizations to prioritize patching efforts by focusing on vulnerabilities with lower attack complexity (easy to exploit) while addressing critical vulnerabilities that could pose significant risks.
Exploitable Application Summary - The Exploitable Application Summary widget offers an analysis of application vulnerabilities categorized by severity levels (Low, Medium, High, and Critical) and their exploitability ease. Using the CVSSv3 Attack Complexity metric, vulnerabilities are classified as 'Hard to Exploit' for high complexity and 'Easy to Exploit' for lower complexity. Additionally, vulnerabilities deemed 'Not Exploitable' are highlighted. This widget helps organizations assess the risk landscape of applications and allocate resources effectively to address vulnerabilities that are easier for attackers to exploit, especially those with critical severity.